Hypertree Network Map
The Hypertree Network Map provides an alternate method of viewing the network from IntraVUE's map. Each map has it's advantages. The IntraVUE Topology Map can be hard to read if an outlying switch has many connections. Text and devices tend to overlap.
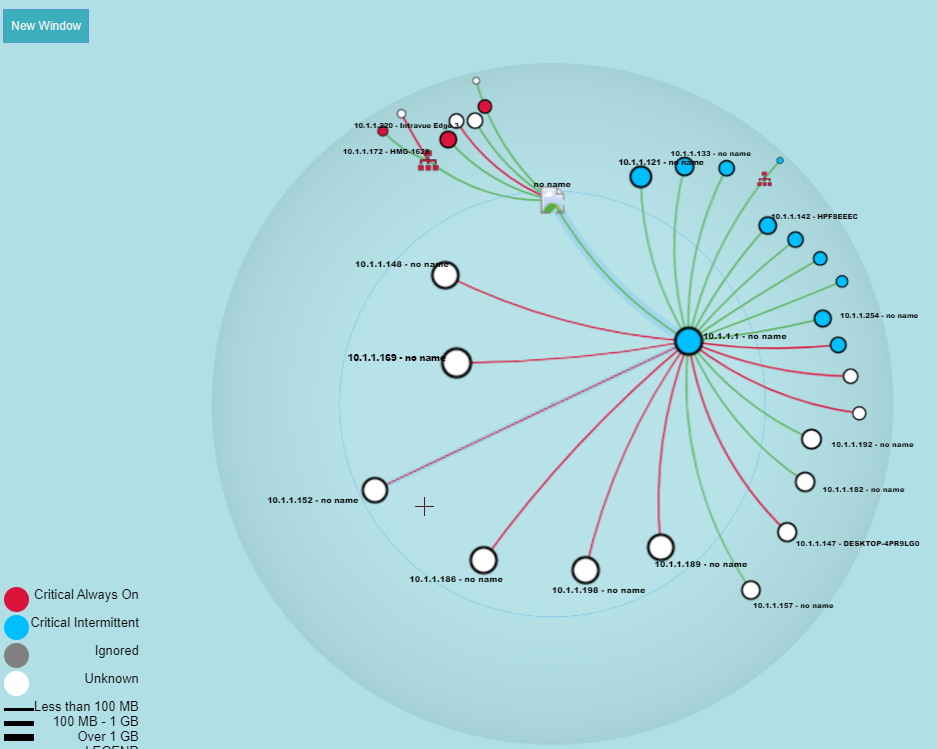
The Hypertree Map allows the user to zoom and pan around the network and always provides separation of the devices, similar to the original IntraVUE 2 which had a hyperbolic tree view where the area was an ellipse. The WBC Network Health Monitor Hypertree Map is a circle, an elliptical view which would show more devices is not available.
When the Hypertree Map is selected, it is displayed using the values in the Options Control Panel which are 'remembered'.
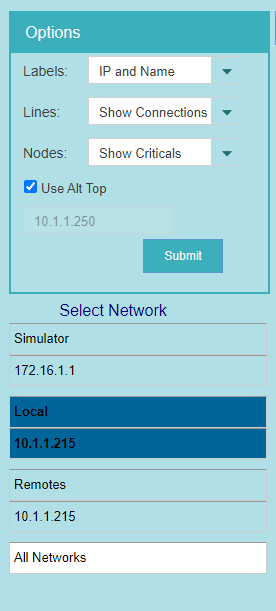
Labels has selections for Names only, IP Address only, Name then IP, IP then Name. If Name Only is selected and a device does not have a name the IP will be displayed.
Lines allows the user to change the connection lines. 'Show Connections' will be like IntraVUE having red and green lines. 'Gray' will make all lines gray. There may be other options depending on the map type.
Nodes allow the user to change the meaning of the end points. 'Show Criticals' will color code the critical state of devices and display a legend of colors in the left bottom corner. 'Show Images' will display the images configured in Intravue and 'Gray' will make all nodes gray.
NOTE: If nodes is in the 'Show Criticals' setting and a red nodes having a red connecting line going to it indicates that critical always on device is disconnected.
Use Alt Top, allows the user to display the map using any device as the network top device in the map. The IP of the device is set in the network info of the Status Page.
The map is panned and zoomed using the mouse and mouse wheel.
The New Window button will display the map in a new browser window without the rest of the Dashboard, significantly increasing the area available for viewing map data.
The Select Network section provides the ability to choose which network to view.
If you click on a node, addition information about the device is displayed to the left of the map.
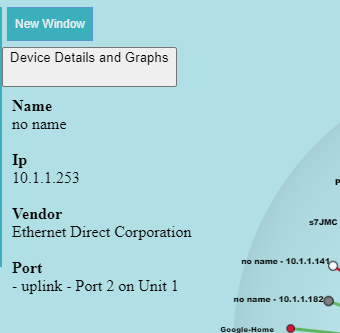
A further 'button', Device Details and Graphs, will show even more device info plus 3 graphs/charts for the device - Ping Response time, Bandwidth, and the Ping Failures and Disconnections chart. See DeviceInfo Popup for more details.
