IntraVUE Status
The Status page is displayed each time a connection is made to an IntraVUE host. It is also automatically updated every 20 minutes and can be updated on demand using the Refresh button.
Important statistics are displayed with color coded labels. In combination with the Alarms and Warnings in the status bar, seeing all green label colors tells the user everything is good with the host IntraVUE
At the very top are three buttons.
- Instant NHM PDF Status Report will take about 10 seconds to generate a detailed report,
- IntraVUE PDF Analysis Report will generate the same PDF report that IntraVUE generates when you create a support archive and upload it to the Intravue Report Generator website and then got a pdf report in an email without any work,
- and Refresh Now will collect new data normally refreshed every 20 minutes to be collected immediately.
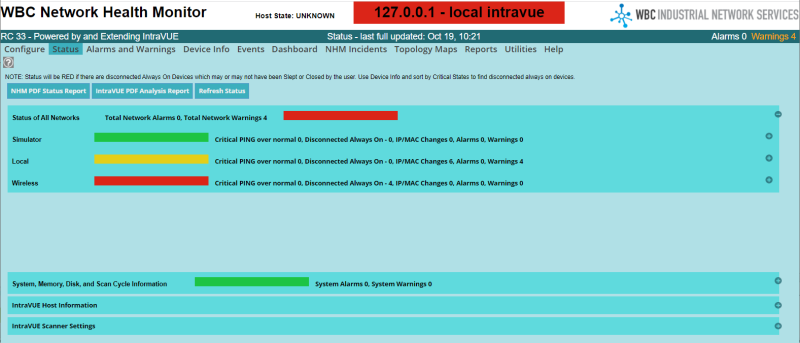
There are 4 sections of the Status page:
- Status of All Networks
- System, Memory, Disk, and Scan Cycle Information
- IntraVUE Host Information
- IntraVUE Scanner Settings
Status of All Networks
The most important is Status of All Networks in the first row. It is color coded green, yellow, or red to indicate overall IntraVUE status/health, and is the worst case for any individual network. Each configured network will have a color coded health line below the Status of All Networks indicating its health.
Additionally, the NHM header row will show the IP address of the currently selected IntraVUE host will a colored background equal to the worst case network.
The header row will also show the current Host State. When WBC Network Health Monitor initiallly starts it goes through a progression of states connecting to the host. In order they are:
-
DB_CREATE_VALIDATE - create and/or validate the NHM database for this IntraVUE
UNKNOWN - state is not known, try to determine the state
HOST_RESPONDING - IntraVUE is responding, check for valid registration, check ivDashboard is responding, check IntraVUE database state
DB_INVALID, DB_OFFLINE, DB_STOPPED, DB_ONLINE - possible database states
SCANNER_STOPPED - probable registration issue
Clicking on one of the individual Network lines will expand the visible data.
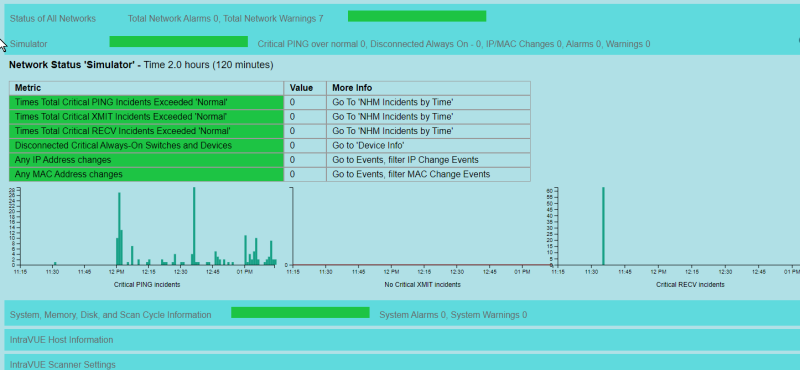
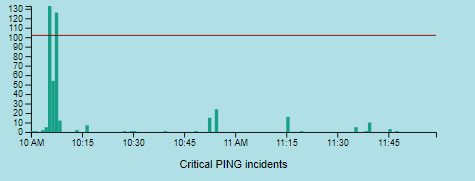
A number of statistics are presented that will indicate why the status is not 'green'. Additionally a graph of the last 2 hours worth of NHM incidents are displayed for each threshold type. If there are any values which exceed the calculated acceptable limit, a horizontal line will show the limit.
System, Memory, Disk, and Scan Cycle Information
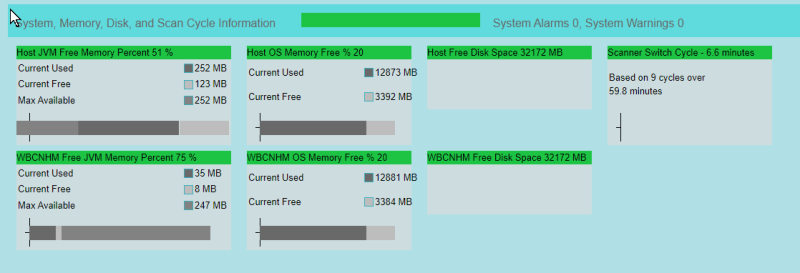
Clicking on this line expands the information to show the following:
- JVM free memory of the IntraVUE host. The Java Virtual Machine (JVM) that powers WBC Network Health Monitor and IntraVUE reserves more memory than in actually uses at any time. The Current Used + Current Free memory shows how much memory is being used.
- JVM free memory for WBC Network Health Monitor
- IntraVUE Host Operating System free memory
- Operating System free memory on the computer hosting WBC Network Health Monitor
- Free Diskspace on the IntraVUE host computer. More than 600 MB will display green, between 300 and 600 will be yellow, and less than 300 will be red. In addition if below 300 a Warning will be created.
- Free Diskspace on the computer hosting WBC Network Health Monitor
- Scanner Switch Cycle shows the time it takes for IntraVUE to get all the SNMP data needed from the managed switches to calculate network topology. The time it takes IntraVUE to perform one cycle of getting SNMP data from all managed switches is dependent of several factors - the number of switches, the speed setting of IntraVUE, if the switches are Cisco, how many devices are being pinged, and more. WBC Network Health Monitor reads the IntraVUE log file and finds the entries that tell when the cycle has completed. The color code used depends on the number of devices. The actual number of cycles completed and the number of minutes reviewed are displayed as well. Generally a network less than 200 devices should complete in less than 3 minutes and in a large network over 800 devices in less than 8 minutes.
IntraVUE Host Information

Other information is displayed such as
- IntraVUE software version
- ivDashboard software version that is installed in the host IntraVUE
- The host operating system. If the host is running under Windows, the status of Arp Clearing Daemon service is displayed. If enabled, IntraVUE clears the arp cache after every ping cycle (multiple per minute) to prevent the Windows behavior of sending all outstanding arp requests without any delay between packets. This may cause issues with some older devices like PLC5's. If you do not have these devices you can disable the service in the Windows Services panel.
- The current Scanner Speed
- How many total devices have been found
- The network adapter found on the host
IntraVUE Scanner Settings
Clicking on the light blue line expands the selection to show each configured IntraVUE network.
Clicking on a network expands to show all the scanner settings for that network.

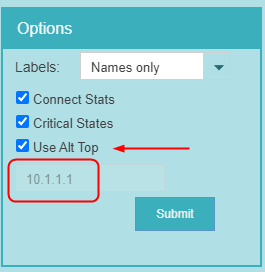
In some cases where the IntraVUE Top Parent is an IntraVUE Edge or a Window's computer it is desirable to see a map of the network using the router as the top device in the network map. WBC Network Health Monitor provides a setting for each network to assign an alternate device to use as the 'top' device.

In the Map Control Panels you can select Use Alt Top and the IP set in the Status / Network dialog will be used. This will be disabled if an alternate top device has not been selected.
