Instant NHM PDF Status Report
Configuration
A button at the top of the Status page, will generate this report. The PDF report is both saved to disk as well as displayed in the browser.
When you click on the button a dialog allows the user to enter or update information used by the report. Any field which is changed is remembered for the next time except Report Comments.
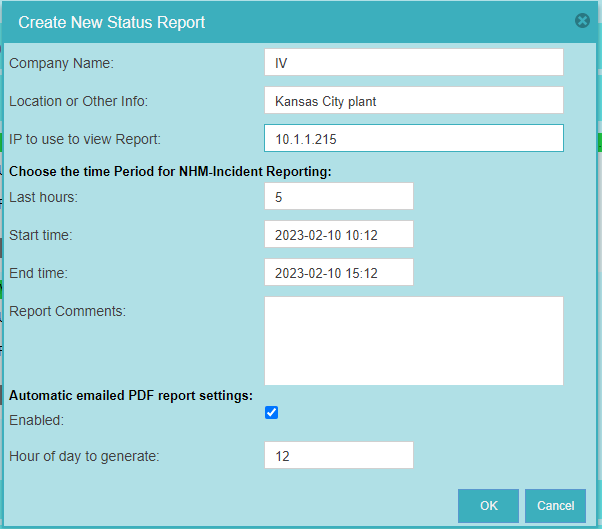
Company Name defaults to the name used to first create the host, but can be changed for report purposes here.
Location is the second line in the report and may contain any text the user feels is helpful.
IP to use to view Report is used primarily when the user is browsing remotely through a jump server and the IP of the WBC Network Health Monitor computer is not accessible. It will default to the domain/ip used in the browser.
The section on Time Period of NHM-Incidents allows the user to set the Start time and End time to be used when analyzing certain statistics such as NHM Incidents. Changing the Hours will make the End time the current time and calculate the correct start time. The user can also explicitly set the Start and End times.
Once a day the PDF report is generated and stored on the host in the /WbcNetworkHealthMonitor/reports folder.
The Enabled checkbox determines if the report will additionally be emailed to the configured email addresses.
The Hour of day to generate field determines the hour in a 24-hour clock the report is to be generated.
The Enabled checkbox determines if the daily PDF report is to be additonally emailed to the configured email addresses.
First Page
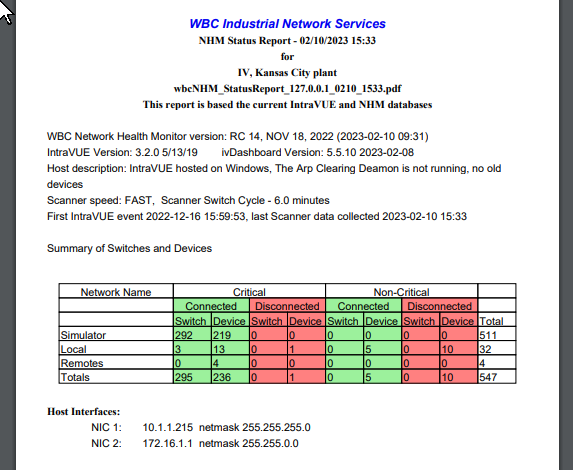
The First Page of the report is a summary of the networks and basic information about the IntraVUE host
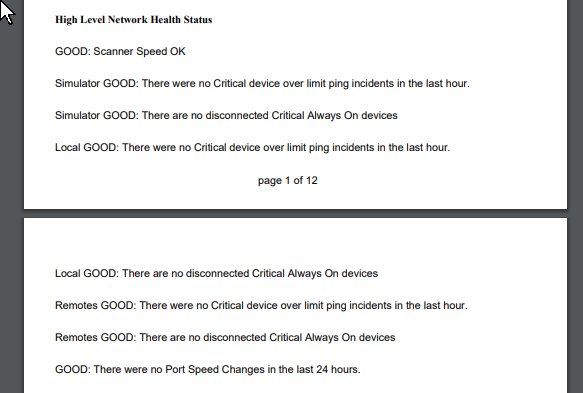
As well as a high level list of GOOD, BAD, WARNING, or NOTE observations.
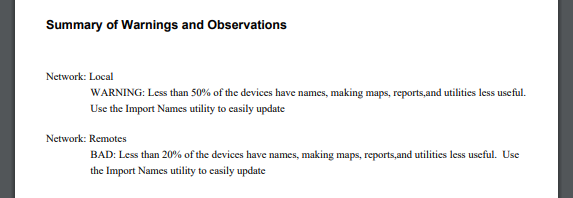
Summary of Warnings and Observations
Next will be a list of all the 'bad' things reported in the details of the individual networks. This section lets the user avoid having to look at the details of every network if they are just looking to see if there are issues.
Network Details for each Network
For each configured IntraVUE network there will a section with helpful summary information.
General Network Details
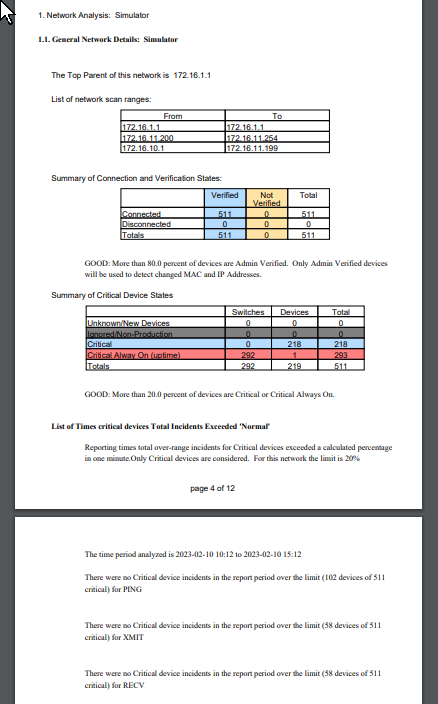
This section lists the scan ranges of this particular network. It also provides a chart of how many devices are Admin Verified and if the are Connected or not.
There is also a chart showing a breakdown of Critical Device states showing how many a Switches and how many are Devices.
There is then a section analyzing only Critical devices for the times the TOTAL number of critical devices exceeded their expected thresholds. This is presented for each of Ping, Receive Bandwidth, and Transmit Bandwidth. To understand more about NHM Incidents see the appendix Understanding NHM Incidents and Events.
Network Configuration
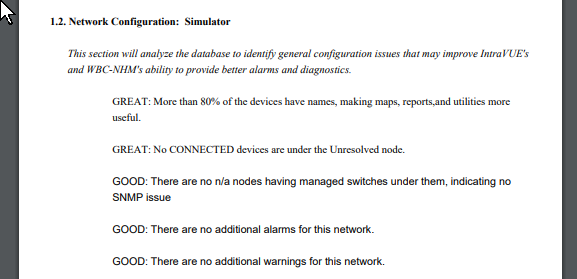
This section analyzes IntraVUE and reports on Configuration issues and if there are any what corrective action to apply.
Network Issues

This section analyzes IntraVUE looking for network issues and suggesting corrective actions if any issues are found.
| Introduction |
|
| Key Features and Benefits |
|
| Getting Started |
|
| Update Intravue |
|
| Notes on User Interface |
|
| Configuration |
|
| Connecting to an IntraVUE |
|
| WBC Network Health Monitor Settings |
|
| Email Settings |
|
| Database Settings |
|
| Real-Time IntraVUE Management |
|
| IntraVUE Status |
|
| IntraVUE Dashboard |
|
| Summary Statistics |
|
| Highest Ping Response Devices |
|
| Highest Bandwidth Devices |
|
| Uptime and Statistics |
|
| Hypertree Network Map |
|
| Tree View Network Map |
|
| Reports |
|
| Device Info |
|
| Alarms and Warnings |
|
| Events |
|
| Threshold Analysis and Configuration Report |
|
| Time Based CRC and IfInErrors Report |
|
| Connection History Report |
|
| 1 Week Disconnected Devices Report |
|
| Disconnections by Minute Chart |
|
| Ping Failures by Minute Chart |
|
| Switchprobe (analysis) Reports |
|
| Utilities |
|
| Device Editor |
|
| KPI Management |
|
| Create a 'clean' database with existing ranges |
|
| Vendor Name Management |
|
| DeviceInfo Popup |
|