Ping Failures by Minute
In IntraVUE Ping Failures do not generate events and are only visible in the sidebar graphs. The 'ping failure percentage' in IntraVUE is the number of times a device responded to a ping divided by how many times it was pinged.
0% means a device was disconnected for the whole minute being reported and 100% means it was connected for the whole minute. Any other percentage indicates a device possibly having communication issues unless the preceding or following minute is either 0% or 100%, indicating a device disconnecting or reconnecting. Some mobile wireless devices might be expected to generate many ping failures as they move between access points, but no other devices.
WBC Network Health Monitor considers any minute in which a ping failure occurs to be a 'ping failure minute'. It does not matter if it was 1 ping in 3, 1 in 10, or 10 in 10; that minute will count as a ping failure minute.
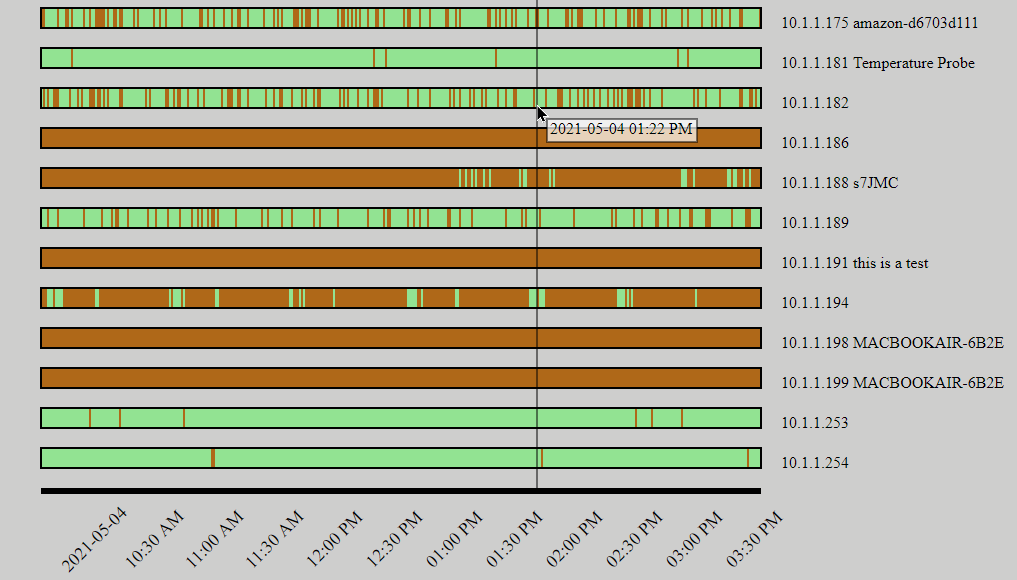
The Ping Failures by Minute Chart allows the user to easily see which devices are having ping failures, the frequency, and most importantly any other devices having the same pattern of ping failures.
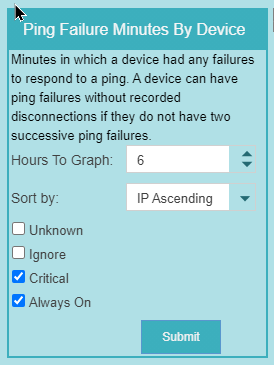
The check boxes of Critical States will show only devices having those states, making it easy to see just critical devices.
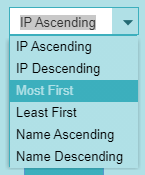
The data can be sorted according to the option selected in the Sort By drop down control.
There is a control to enter the number of Hours to Graph. For each minute that a device had a ping failure, there will be a red line. A red completely filled rectangle means the device was disconnected for the entire period.


Ping failure data is only viewable in device graphs in IntraVUE as a percentage.
This chart makes it possible to compare devices having ping failures and look for times that may have unusual data.
Unlike the Disconnections By Minute Chart, Ping Failures are continuous. A disconnected device will show with solid lines for every minute of disconnection because ping failures are at 100%. The user should be concerned with devices that are having ping failures which may not be having disconnections.
As the mouse moves in the graph, a vertical line shows the time of the disconnections.
A svg export icon allows you to save the graph for printing.

