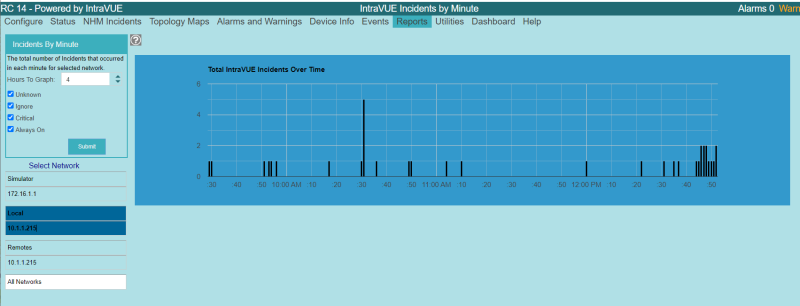
IntraVUE Incidents by Minute
The IntraVUE Incidents by Minute dialog provides an alternate view into IntraVUE Analytics. This dialog shows the 'IntraVUE incidents' in a short time scale compared to IntraVUE's 30 day scale. Like IntraVUE, it allows the selection of which types of Critical Devices to include as well as which network to view.
| Introduction |
|
| Key Features and Benefits |
|
| Getting Started |
|
| Update Intravue |
|
| Notes on User Interface |
|
| Configuration |
|
| Connecting to an IntraVUE |
|
| WBC Network Health Monitor Settings |
|
| Email Settings |
|
| Database Settings |
|
| Real-Time IntraVUE Management |
|
| IntraVUE Status |
|
| IntraVUE Dashboard |
|
| Summary Statistics |
|
| Highest Ping Response Devices |
|
| Highest Bandwidth Devices |
|
| Uptime and Statistics |
|
| Hypertree Network Map |
|
| Tree View Network Map |
|
| Reports |
|
| Device Info |
|
| Alarms and Warnings |
|
| Events |
|
| Threshold Analysis and Configuration Report |
|
| Time Based CRC and IfInErrors Report |
|
| Connection History Report |
|
| 1 Week Disconnected Devices Report |
|
| Disconnections by Minute Chart |
|
| Ping Failures by Minute Chart |
|
| Switchprobe (analysis) Reports |
|
| Utilities |
|
| Device Editor |
|
| KPI Management |
|
| Create a 'clean' database with existing ranges |
|
| Vendor Name Management |
|
| DeviceInfo Popup |
|