Uptime and Statistics
Note: The devices that are used in collecting data are defined by the Critical Device Selection
Note: A newer Uptime Report has been added to the Reports menu providing a different set of data and capabilities.
The Uptime and Statistics section of the chart shows the number of total devices for the current network setting that are in each category.
For any device having incidents the chart shows the IP Address, Name, Switch (yes/no), The Critical Status, also called KPI Level, uptime percentage over the selected period if the device is Critical Always On, and then a break out of statistics by type of event/incident. Only devices having incidents are shown.
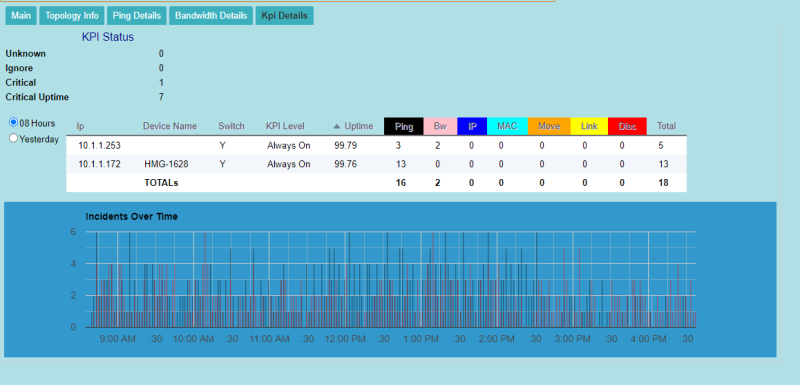
The Chart is a bar graph showing the number of Total incidents that occurred, by type, in each minute. Hover text supplies more information.
The bar colors match the colors of the statistic's column headings.
