IntraVUE Dashboard
The Dashboard Page contains a lot of information. Each section is described below using the numbers in the image.
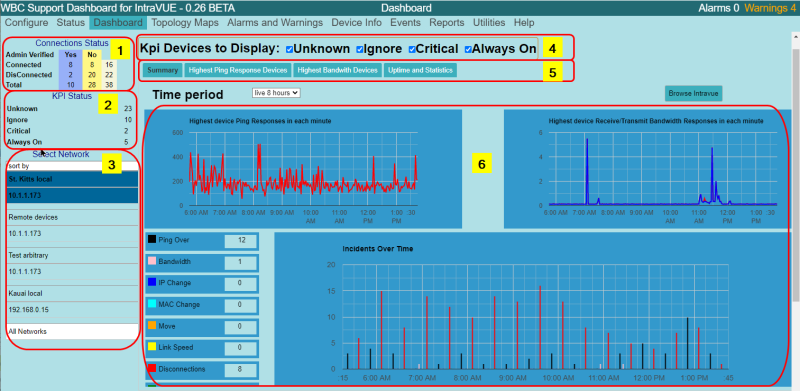
1. Connections Status shows the number of devices that are Connected or Disconnected for the current selection in Select Networks (3). They are further classified as Admin Verified or not.
2. KPI Status shows the number of devices for the currently selected Network in each Critical State.
3. Select Network allows changing which network is viewed and if there are more than 1, All Networks will be an additional selection. This control is present in several dialogs and the selection is remembered as you switch dialogs.
4. KPI Devices to Display allows the user to filter which devices will be graphed in sections 6 and 7 The selection is remembered between sessions and among the different dialogs that allow you to select the network of interest. It allows the user to focus on just the device types of interest,e.g. Critical Intermittent and Critical Always On devices when only those 2 check boxes are checked. The checks are persistent and will default to the last selection. See Critical Device Selection
5. The Dashboard page has graphics for 4 different views of what is happening in the Network. The Summary page is the default when you first select Dashboard.
6. The main area of the Dashboard page shows the graphs for the selection in 5. In this image the Summary Statistics are shown. Details for each section can be seen by clicking on the links below.
