Highest Ping Response Devices
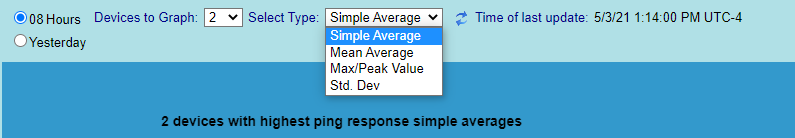
In this chart you may select the number of devices to display. You may also select the method used to select what is 'worst'. The current chocies are:
- Simple Average
- Mean Average
- Maximum/Peak Value
- Standard Deviation above average.
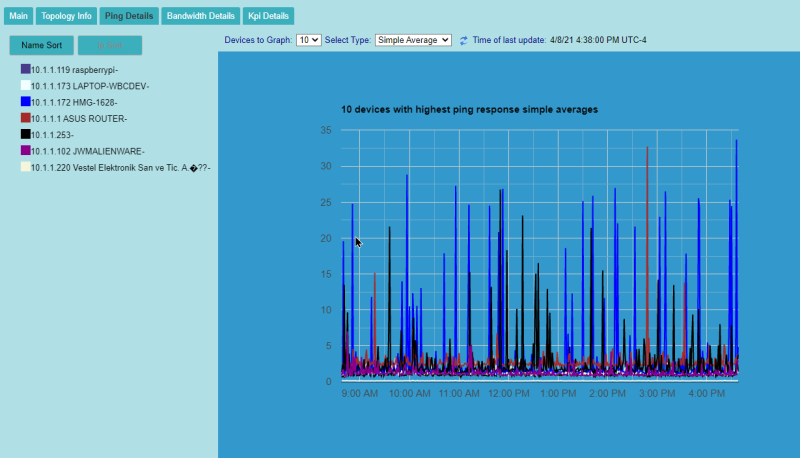
The devices are graphed on the right and their IP Addresses and Names are displayed on the left.
Clicking on a device will highlight the line in the graph, click a line in the graph will highlight the device on the left, in addition to hover text.
Note: The devices that are used in collecting data are defined by the Critical Device Selection
